The effect of short-term particular matter2.5 exposure on asthma attacks in asthma children in Fukuoka, Japan
Article information
Abstract
Objectives
We investigated whether asthma attacks in asthmatic children were caused by short-term exposure to particulate matter(PM)2.5.
Methods
Subjects were 411 patients who received inhalation therapy in National Fukuoka Hospital, from March to May 2013. All subjects were outpatients. We surveyed the air quality measurement results in the stations closest to the address of the patients. Data were used from the City of Fukuoka website data on air pollution. We carried out a case-crossover study and compared PM2.5 concentration between 7 days after asthma attack occurred and the day asthma attack occurred and 1, 2 and 3 days before asthma attack occurred.
Results
Highest hourly concentration of the day (OR 1.013, 95%CI 1.000-1.025) showed a significant association with 1 day before PM2.5 concentration statistically. And 0-1 year-old infants were more vulnerable to the highest concentration of 1 day before PM2.5 concentration(P < 0.05). Average concentration of NO2 and O3 and asthma attack also showed a significant association.
Conclusions
Maximal daily PM2.5 concentrations within 24 hours prior to the attack affect asthma exacerbation. 0-1 year-old infants are particularly vulnerable to PM2.5 concentration. Asthma exacerbation is aggravated by NO2 and O3 concentration on the day of the asthma attack.
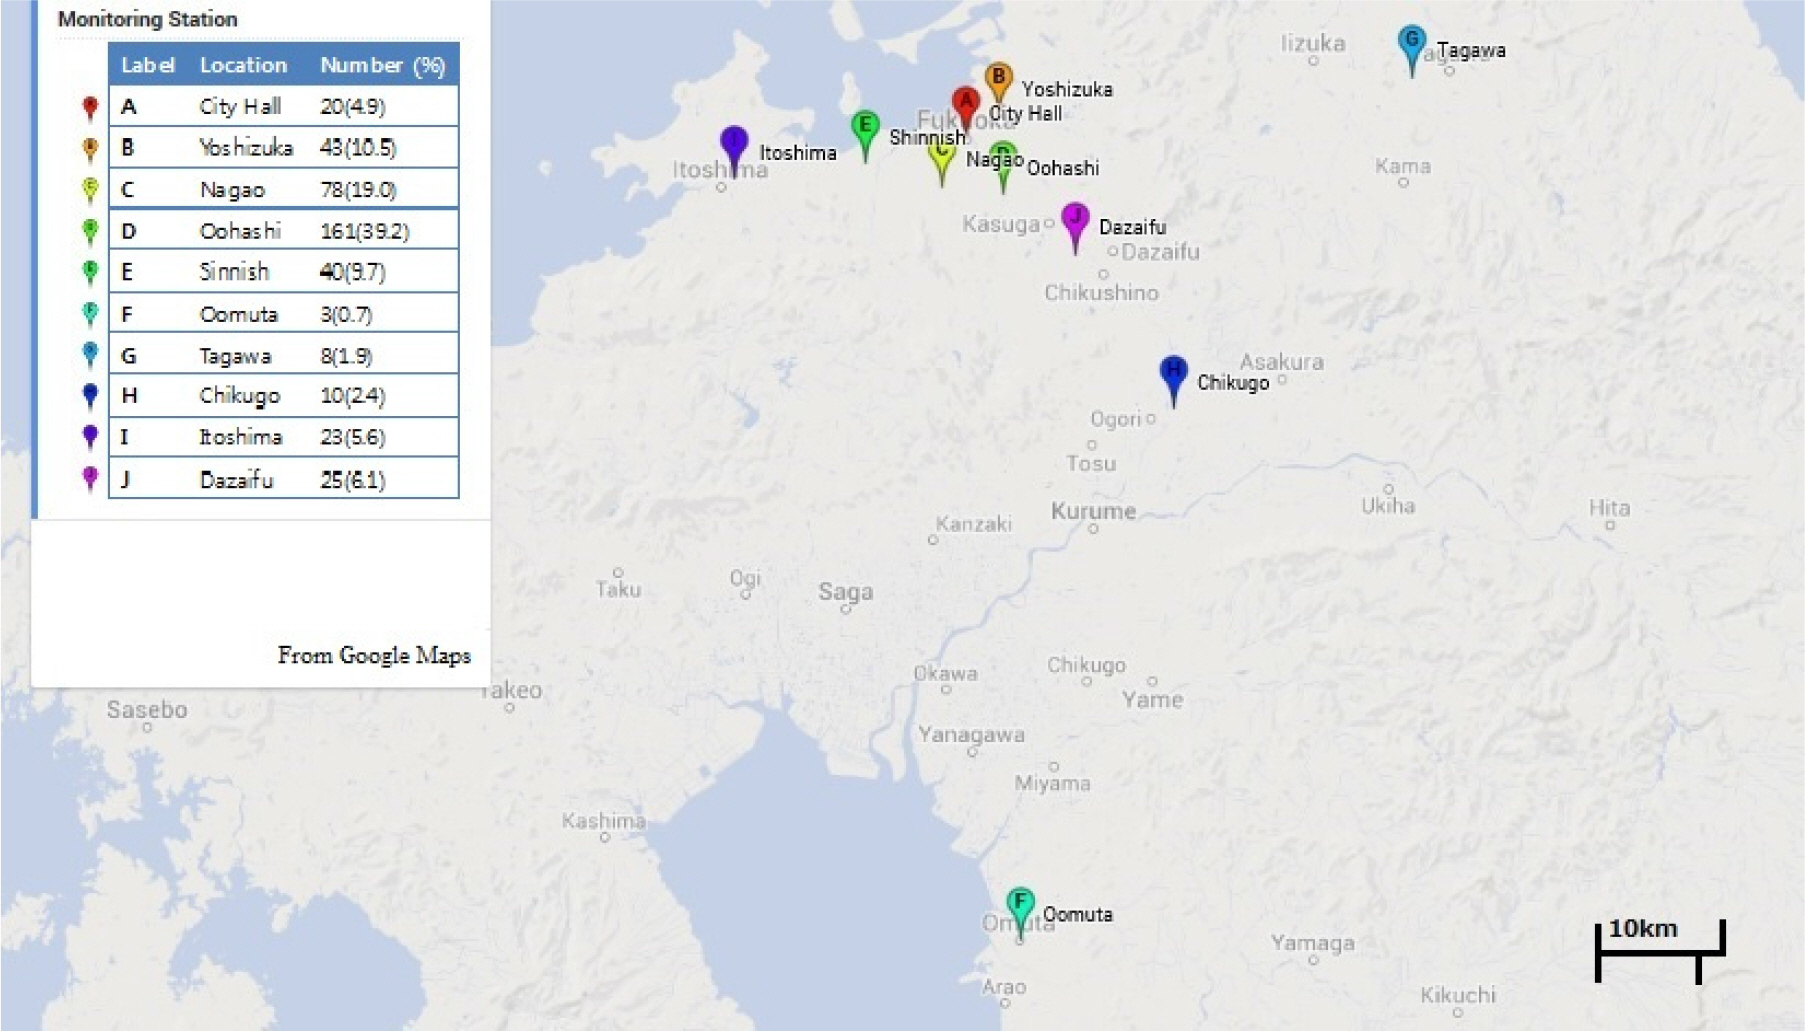
Map of monitoring stations in Fukuoka. The table on the left shows the names of monitoring stations, the number of asthma patients, and percentage.

Characteristics of the study groups.
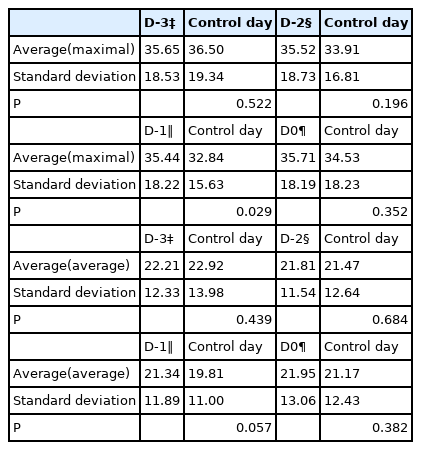
Comparison of maximal, average concentration of PM2.5 (μg/㎥).

Odds ratios and 95% confidence intervals of asthma attack by maximal 1-hour concentration of each air pollutant.

Odds ratios and 95% confidence intervals of asthma attack by average daily concentration of each air pollutant.
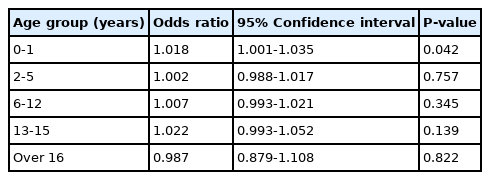
Odds ratios and 95% confidence intervals of asthma attack by maximal 1-hour concentration of PM2.5 divided by age group.