High Proportion of Nervous System Disease among Major Cause of Under-Five Death in Korea; Compared with OECD 14 Nations (2005-2010)

Article information

Kosin Med J. 2014;29(1):37-45
Publication date (electronic) : 2014 December 17
doi : https://doi.org/10.7180/kmj.2014.29.1.37
1Department of Pediatrics, Dae-Dong Hospital, Busan, Korea
2Department of Preventive Medicine, College of Medicine, Kosin University, Busan, Korea
Corresponding Author: Kwang Wook Koh, Department of Preventive Medicine, Kosin University College of Medicine, 34 Amnam-dong, Seo-gu, Busan, 602-702, Republic of Korea TEL: +82-51-990-6426 FAX: +82-51-990-3036 E-mail: kwkoh@kosin.ac.kr
Received 2013 January 31; Revised 2013 June 23; Accepted 2013 July 23.

Abstract

Abstract

Objectives

To compare the mortality rate of children under ages five from different countries by their causes and to explore the cause of death that is relatively higher in South Korea and came up with measures for resolution.

Methods

The statistics were based from section ICD(International Classification of Diseases)-10 of WHO(World Health Organization) Mortality Database. Among the OECD(Organization for Economic Cooperation and Development) countries, 15 countries with higher GDP(Gross Domestic Product) than South Korea were studied by the mortality rate from 2005 to 2010 sorted into two groups: 0 year group and 1-4 years group. Then the cause of death investigated in detail.

Results

Among the 15 countries, average mortality of 0 year group in Korea ranked 8th and the average mortality of 1-4 years group ranked 4th out of 15. There were no significance in the mortality of 0 year group caused by any specific disease, but unnatural death was ranked 2nd after the United States. The natural death of 1-4 years group was ranked 6th, and the unnatural death was ranked 2nd after the Unites States. Among the natural deaths of 1-4 years group, the cause of death significantly higher was found to be disease G(nervous system disease). Among the subgroups of disease G, the orders went epilepsy, cerebral palsy, paralysis, and inflammatory disease.

Conclusions

We have identified major causes of death of children under age 5. The highest proportion of cause of death in 1-4 years group was nervous system disease and we have proposed resolution. Henceforth, this data will be used as a foundational data for formulating policies relation to the Mother-Child Health.

Fig. 1.

Cause of death at age 0 consists mostly of natural death. In mortality rate of age 0, South Korea is ranked 8th out of 15 countries.

Fig. 2.

The proportions of unnatural death among cause of death from age 0 to age 4 is higher than at age 0. In mortality rate from age 1 to age 4, South Korea ranked 4th out of 15 countries.

Fig. 3.

In the proportion of unnatural death among cause of death from age 1 to age 4, South Korea is ranked 2th out of 15 countries.

Mortality rate from one to four age by major nine codes (2005-2010)

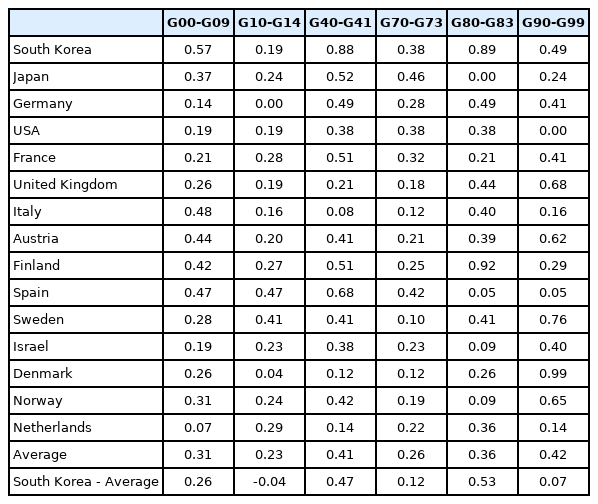
Mortality rate from age 0 to age 4 by subgroups of G code (2005-2010)

References

1. Statistics Korea. A report of statistical analysis of infant mortality base on the birth data. Seoul: Statistics Korea. 2011. 2–6.
2. World Health Organization. WHO Mortality Database: Tables [Internet] [cited 2012 July 09]. Available from. http://www.who.int/healthinfo/statistics/morttables/en/index.html.
3. Han YJ, Doh SR, Lee SU, Lee HB, Lee MI. Infant mortality survey report in 1993. Seoul: Korea Ministry of Health and Welfare, Korea Institute for Health and Social Affairs. 1997. 59–60.
4. Korea Ministry of Health and Welfare. Infant mortality survey report in 1996. Seoul: Korea Ministry of Health and Welfare. 1999. 31–7.
5. Korea Ministry of Health and Welfare. Infant mortality survey report in 1999. Seoul: Korea Ministry of Health and Welfare. 2002. 31–43.
6. Han YJ, Seo K, Lee SU, Lee SU, Shin CW. Infant and maternal death survey report in 2002-2003. Seoul: Korea Institute for Health and Social Affairs, Korea Ministry of Health and Welfare 2005. 67–70.
7. Han YJ, Choi JS, Seo K, Lee SU, Lee SU, Shin CW, et al. Infant and maternal death survey report in 2005-2006. Seoul: Korea Institute for Health and Social Affairs, Korean Medical Record Association, Korean Ministry of Health and Welfare. 2008. 79–83.
8. Statistics Korea. Birth statistics [cited 2011 Jun 15]. Available from. http://www.kosis.kr/abroad/abroad_01List.jsp?parentId=A.
9. Chang JY, Lee KS, Hahn WH, Chung SH, Choi YS, Shim KS, et al. Decreasing trends of neonatal and infant mortality rates in Korea: compared with Japan, USA, and OECD nations. J Korean Med Sci 2011;26:1115–23.
10. Han YJ, Choi JS, Lee SW, Seo K, Oh HC, Lee SW, et al. Statistics Korea. A report of statistical analysis of under-five mortality. Seoul: Korea Institute for Health and Social Affairs, Korean Ministry of Health and Welfare. 2009. 25–74.
11. World Health Organization. International statistical classification of diseases and related health problems, 10th revision. Geneva: WHO 2003. 1235–43.
12. World Health Organization. International statistical classification of diseases and related health problems, 10th revision, Vol.2 2nd ed.th ed. Geneva: WHO; 2004. p. 94–100.
13. Ministry for health welfare and family affairs. Infant mortality in Korea 4.1, 4.9 lower than OECD average. Seoul: Ministry for health welfare and family affairs. 2009. 1–4.
14. Won TY, Kang BS, Im TH, Choi HJ. The Study of Accuracy of Death Statistics. J Korean Soc Emerg Med 2007;18:256–62.
15. Reddihough DS. Baikie G. Walstab JE. Cerebral palsy in Victoria, Australia: mortality and causes of death. J Paediatr Child Health 2001;37:183–6.
16. Hwang NM. Maternal and child health services in developed country. Seoul: The Korean Society of Neonatology. 2006. 7–28.
17. Himmelmann K, Hagberg G, Uvebrant P. The changing panorama of cerebral palsy in Sweden. X. Prevalence and origin in the birth-year period 1999-2002. Acta Paediatr 2010;99:1337–43.
18. Andersen GL, Irgens LM, Haagaas I, Skranes JS, Meberg AE, Vik T. Cerebral palsy in Norway: prevalence, subtypes and severity. Eur J Paediatr Neurol 2008;12:4–13.
19. Prevalence and characteristics of children with cerebral palsy in Europe. Dev Med Child Neurol 2002;44:633–40.
20. Park MS, Kim SJ, Chung CY, Kwon DG, Choi IH, Lee KM. Prevalence and lifetime healthcare cost of cerebral palsy in South Korea. Health Policy 2011;100:234–8.
21. Naletilić M, Tomić V, Sabić M, Vlak T. Cerebral palsy: early diagnosis, intervention and risk factors. Coll Antropol 2009;33:59–65.
22. Hutton JL, Pharoah PO. Life expectancy in severe cerebral palsy. Arch Dis Child 2006;91:254–8.
23. Kim KH, Sohn YM, Kang JH, Kim KN, Kim DS, Kim JH, et al. The causative organisms of bacterial meningitis in Korean children, 1986-1995. J Korean Med Sci 1998;13:60–4.

Article information Continued

Fig. 1.

Cause of death at age 0 consists mostly of natural death. In mortality rate of age 0, South Korea is ranked 8th out of 15 countries.

Fig. 2.

The proportions of unnatural death among cause of death from age 0 to age 4 is higher than at age 0. In mortality rate from age 1 to age 4, South Korea ranked 4th out of 15 countries.

Fig. 3.

In the proportion of unnatural death among cause of death from age 1 to age 4, South Korea is ranked 2th out of 15 countries.

Table 1.

Mortality rate from one to four age by major nine codes (2005-2010)

  G00-G09 G10-G14 G40-G41 G70-G73 G80-G83 G90-G99
South Korea 0.57 0.19 0.88 0.38 0.89 0.49
Japan 0.37 0.24 0.52 0.46 0.00 0.24
Germany 0.14 0.00 0.49 0.28 0.49 0.41
USA 0.19 0.19 0.38 0.38 0.38 0.00
France 0.21 0.28 0.51 0.32 0.21 0.41
United Kingdom 0.26 0.19 0.21 0.18 0.44 0.68
Italy 0.48 0.16 0.08 0.12 0.40 0.16
Austria 0.44 0.20 0.41 0.21 0.39 0.62
Finland 0.42 0.27 0.51 0.25 0.92 0.29
Spain 0.47 0.47 0.68 0.42 0.05 0.05
Sweden 0.28 0.41 0.41 0.10 0.41 0.76
Israel 0.19 0.23 0.38 0.23 0.09 0.40
Denmark 0.26 0.04 0.12 0.12 0.26 0.99
Norway 0.31 0.24 0.42 0.19 0.09 0.65
Netherlands 0.07 0.29 0.14 0.22 0.36 0.14
Average 0.31 0.23 0.41 0.26 0.36 0.42
South Korea - Average 0.26 -0.04 0.47 0.12 0.53 0.07

Mortality rate: number of death per 100,000 people.

A-B: Certain infectious and parasitic diseases, C: Neoplasms, D: Diseases of the blood and blood-forming organs and certain disorders involving the immune mechanism, E: Endocrine, nutritional and metabolic diseases, G: Diseases of the nervous system, I: Diseases of the circulatory system, J: Diseases of the respiratory system, Q: Congenital malformations, deformations and chromosomal abnormalities, R: Symptoms, signs and abnormal clinical and laboratory findings, not elsewhere classified.

Table 2.

Mortality rate from age 0 to age 4 by subgroups of G code (2005-2010)

  G00-G09 G10-G14 G40-G41 G70-G73 G80-G83 G90-G99
South Korea 0.57 0.19 0.88 0.38 0.89 0.49
Japan 0.37 0.24 0.52 0.46 0.00 0.24
Germany 0.14 0.00 0.49 0.28 0.49 0.41
USA 0.19 0.19 0.38 0.38 0.38 0.00
France 0.21 0.28 0.51 0.32 0.21 0.41
United Kingdom 0.26 0.19 0.21 0.18 0.44 0.68
Italy 0.48 0.16 0.08 0.12 0.40 0.16
Austria 0.44 0.20 0.41 0.21 0.39 0.62
Finland 0.42 0.27 0.51 0.25 0.92 0.29
Spain 0.47 0.47 0.68 0.42 0.05 0.05
Sweden 0.28 0.41 0.41 0.10 0.41 0.76
Israel 0.19 0.23 0.38 0.23 0.09 0.40
Denmark 0.26 0.04 0.12 0.12 0.26 0.99
Norway 0.31 0.24 0.42 0.19 0.09 0.65
Netherlands 0.07 0.29 0.14 0.22 0.36 0.14
Average 0.31 0.23 0.41 0.26 0.36 0.42
South Korea - Average 0.26 -0.04 0.47 0.12 0.53 0.07

Mortality rate: number of death per 100,000 people G00-G09: Inflammatory diseases of the central nervous system, G10-G14: Systemic atrophies primarily affecting the central nervous system, G40-G41: Epilepsy and status epilepticus, G70-G73: Diseases of myoneural junction and muscle, G80-G83: Cerebral palsy and other paralytic syndromes, G90-G99: Other disorders of the nervous system