Evaluation of automated calibration and quality control processes using the Aptio total laboratory automation system
Article information

Abstract
Background
The objective of this study was to determine whether manually performed calibration and quality control (QC) processes could be replaced with an automated laboratory system when installed analyzers fail to provide automated calibration and QC functions.
Methods
Alanine aminotransferase (ALT), total cholesterol (TC), creatinine (Cr), direct bilirubin (DB), and lipase (Lip) items were used as analytes. We prepared pooled serum samples at 10 levels for each test item and divided them into two groups; five for the analytical measurement range (AMR) group and five for the medical decision point (MDP) group. Calibration and QC processes were performed for five consecutive days, and ALT, TC, Cr, DB, and Lip levels were measured in the two groups using automated and manual methods. Precision and the mean difference between the calibration and QC methods were evaluated using the reported values of the test items in each group.
Results
Repeatability and within-laboratory coefficients of variation (CVs) between the automated system and the conventional manual system in the AMR group were similar. However, the mean reported values for test items were significantly different between the two systems. In the MDP group, repeatability and within-laboratory CVs were better with the automation system. All calibration and QC processes were successfully implemented with the Aptio total laboratory automation system.
Conclusion
The Aptio total laboratory automation system could be applied to routine practice to improve precision and efficiency.
Introduction
Automation systems in laboratory have been developed to make testing processes more standardized and efficient for workers to complete their tasks without human errors [1-3]. Currently, a laboratory automation system provides new options for a clinical laboratory to automate front-end processing with its applications widened [4-6]. Although calibration and quality control (QC) processes are the first step of routine laboratory testing, laboratory automation system has been mainly focusing on processes other than calibration and QC. In general, total laboratory automation system does not include automation of calibration or QC unless instruments installed in the automation system provide automated calibration and QC functions.
A laboratory automation system can also be applied to help routine calibration and QC processes regardless of auto-calibration and auto-QC functions of installed instruments depending on manufacturers [7]. Calibration and QC processes are routinely performed almost every day as the front step of laboratory testing process which is very important for the accuracy and traceability of tests [8,9]. Although it should be different depending on the size of hospital, the total time taken for these processes is not short, lasting as long as one hour or more. Therefore, if this front step is automatically completed before technicians arrive at their workplace, we can save time and report test results sooner than usual by skipping manual processes needed for the calibration and QC. This not only reduces total testing time, but also improves efficiency of laboratory routines. Once calibration and QC processes are performed automatically by the machine, we can expect improvement in reproducibility and precision of repeated tests by reducing inevitable bias caused by individual differences or even differences within the same individual [10].
The Aptio total laboratory automation system (Siemens Healthcare Diagnostics Inc., Tarrytown, NY, USA) can perform serial testing processes such as decapping, testing, recapping, and storing of reagents and sample tubes as it is designed with a middleware. We had an Aptio total laboratory automation system and ADVIA centaur XPT system (Siemens Healthcare Diagnostics Inc.) installed in our laboratory. Because the ADVIA centaur XPT chemistry analyzer does not provide auto-calibration or auto-QC functions, we devised an algorithm for the Aptio automation system to automatically conduct the calibration and QC processes using various functions needed for automated calibration and QC. We compared performances of calibration and QC processes conducted by conventional manual method with those conducted by the Aptio automation system in this study. The objective of this study was to determine whether manually performed calibration and QC processes could be replaced with laboratory automated system when installed analyzers failed to provide automated calibration and QC functions [11].
Methods
Ethical statements: This study was approved by the Institutional Review Board of the Kosin University Gospel Hospital (IRB No. KUGH 2018-12-013) and informed consent was waived.
Alanine aminotransferase (ALT), total cholesterol (TC), creatinine (Cr), direct bilirubin (DB), and lipase (Lip) items were used as analytes. These were selected because ALT, TC, Cr, DB, and Lip are commonly requested and, empirically, we have confronted more problems with these test items regarding accuracy and traceability in our laboratory in relation to other common test items. We prepared pooled serum samples at 10 levels for each test item and divided them into two groups; five for the analytical measurement range (AMR) group and five for the medical decision point (MDP) group. AMR is the range of analyte values that a method can directly measure on the specimen without any dilution, concentration, or other pretreatments [12]. We set the AMR according to the claimed range by the manufacturer of each analyte. MDP range included medically important values or cutoffs for abnormal test results in each test item. We performed calibration and QC processes for five consecutive days and measured each test item in the two groups.
Each testing was done three times for each level. We also used analyte-specific QC materials with high and low levels to calculate precisionfs for the AMR group and the MDP group, respectively. All statistical analyses were performed with Analyze-it version 5.11 (Analyze-it Software Ltd., Leeds, UK) and SPSS version 25 (IBM Corp., Armonk, NY, USA).
Automated calibration and QC activity were performed using an Aptio total laboratory automation system (Siemens Healthcare Diagnostics Inc.). An ADVIA XPT chemistry analyzer (Siemens Healthcare Diagnostics Inc.) was used to measure tested items using pooled serum and QC materials. All processes including storing, decapping, and recapping of reagents for calibration and QC activities during this study were programmed in advance and performed by the Aptio automated system to evaluate the performance of the automated system.
1. Precisions for the AMR group, the MDP group, and QC materials
We calculated repeatability and within laboratory coefficient of variations (CVs) for the AMR group, the MDP group, and QC materials, respectively. The precision of the two systems was calculated for ALT, TC, Cr, DB, Lip, and QC materials according to the protocols of the Clinical and Laboratory Standards Institute (CLSI) EP15-A3 [13,14].
2. Mean difference between automated system and manual system
We calculated mean differences between values of ALT, TC, Cr, DB, Lip, and QC materials obtained with the Aptio total laboratory automation system and those obtained with the conventional manual method in AMR and MDP groups. As the number of paired samples was not large enough for each item, differences between the two systems were compared with Wilcoxon signed-rank test (non-parametric analysis) and paired t-test (parametric analysis).
3. Bland-Altman analysis for the two systems
We plotted differences between values of ALT, TC, Cr, DB, Lip, and QC materials obtained with the Aptio total laboratory automation system and those obtained with the conventional manual method in AMR and MDP groups. Bland-Altman analysis was performed to determine the bias between the two systems.
Results
All experiments proceeded when QC results were within allowable ranges after the calibration process was accepted through automated and manual methods.
1. Precisions for the AMR group, the MDP group, and QC materials
Mean CVs (standard deviation, SD) of repeatability between the conventional manual method and the automated system for the AMR group were 4.8% (0.041) and 4.9% (0.032) for ALT, 1.1% (<0.001) and 0.8% (0.002) for TC, 2.2% (0.020) and 2.0% (0.022) for Cr, 2.3% (0.003) and 1.9% (0.001) for DB, and 2.8% (0.012) and 4.3% (0.018) for Lip, respectively (Table 1). Repeatability CV (SD) and within laboratory CV were higher with the automated system than those with the conventional manual method (2.1% [0.017] and 2.8% [0.024] vs. 2.0% [0.019] and 2.6% [0.023], respectively).
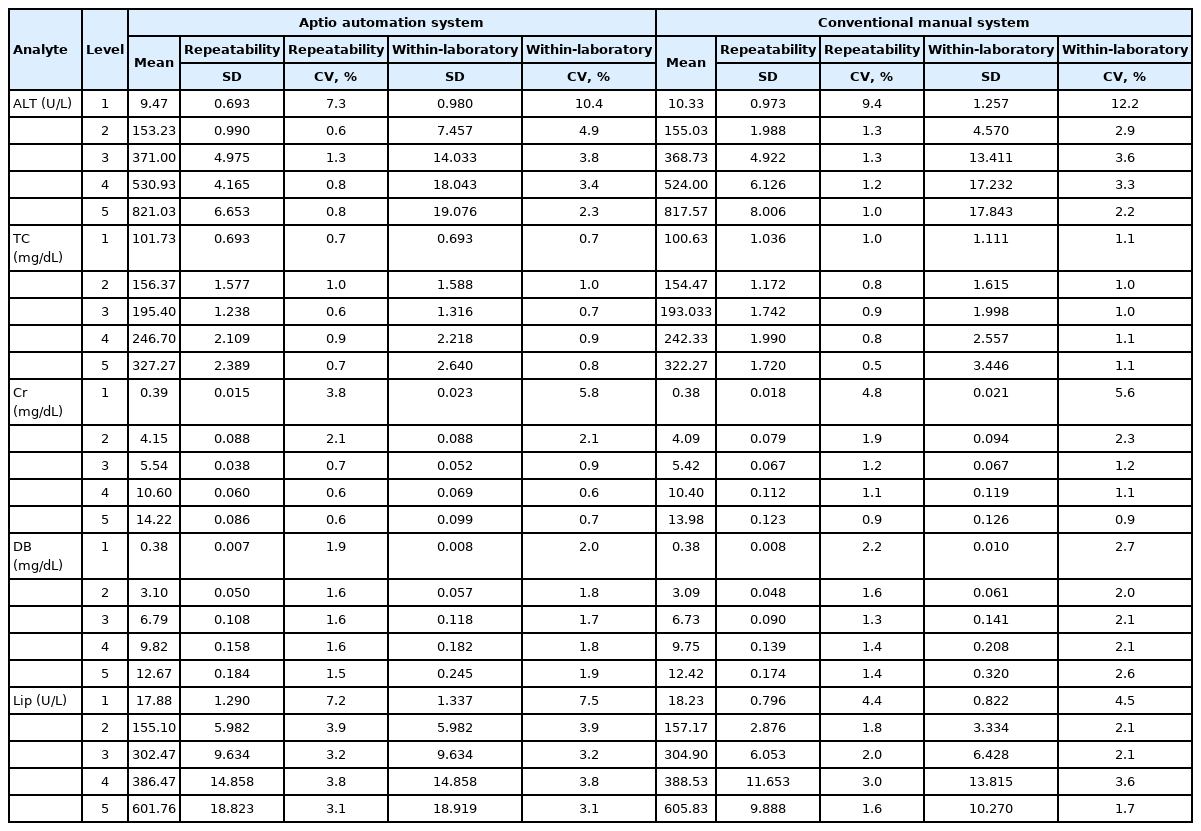
Precision of the conventional manual system and the Aptio automation system for the analytical measurement range group
Mean CVs (SD) of repeatability between the conventional manual method and the automated system for the MDP group were 4.9% (0.001) and 4.7% (0.007) for ALT, 1.1% (0.002) and 0.9% (0.001) for TC, 13.1% (0.008) and 2.1% (0.004) for Cr, 3.2% (0.007) and 2.7% (0.006) for DB, and 3.1% (0.004) and 3.0% (0.010) for Lip, respectively (Table 2). Repeatability CV (SD) and within laboratory CV were lower with the automated system than those with the conventional manual method (1.8% [0.009] and 2.7% [0.014] vs. 3.8% [0.034] and 5.1% [0.043], respectively).
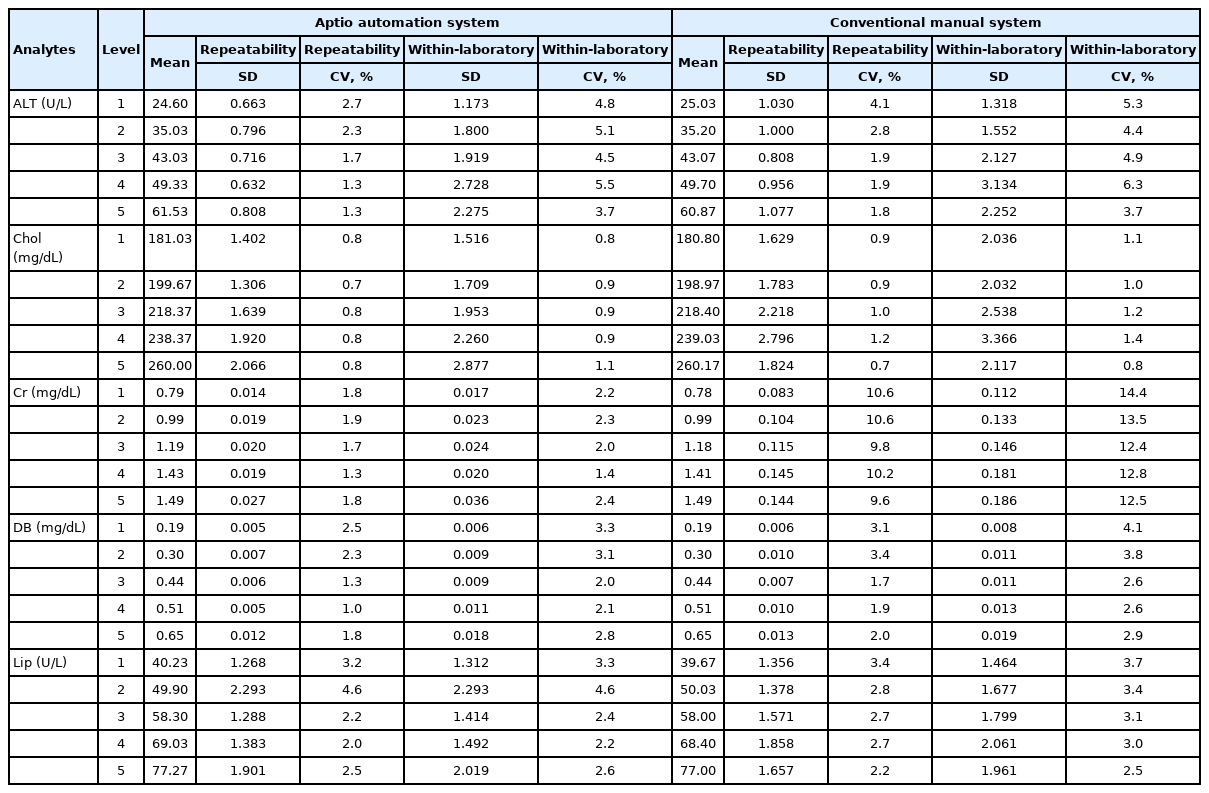
Precision of the conventional manual system and the Aptio automation system for medical decision point group
The mean repeatability CV (SD) and within laboratory CV (SD) of QC materials were 2.3% (0.011) and 3.4% (0.019) with the automated system and 3.2% (0.026) and 4.2% (0.030) with conventional manual method, respectively (Table 3).

Precision of the conventional manual system and the Aptio automation system using quality control materials
2. Mean differences in the AMR group, the MDP group, and QC materials
Means of tested items evaluated with the automated system were significantly different from those evaluated with the manual method for the AMR group (p=0.008). However, those of tested items between the two methods were not significantly different for the MDP group (p=0.413) (Table 4).

Mean difference between the AMR and MDP groups
When each test item in the AMR group was analyzed, there were significant differences between mean values of tested items (ALT, TC, Cr, DB, and Lip) by the automated system and those by the manual method in parametric and non-parametric analyses (p<0.001 in t-test and Wilcoxon signed-rank test for ALT, TC, Cr, and DB; p=0.013 in t-test and p=0.016 in Wilcoxon signed-rank test for Lip). However, in the MDP group, only Lip was significantly different in the non-parametric method (p=0.029 in Wilcoxon signed-rank test and p=0.082 in t-test) (Table 4).
Two QC materials (low and high levels) were used to calculate mean differences in each system. There was no significant difference in ALT, DB, or Lip between the two systems (p>0.05). However, QC values of TC and Cr were significantly different (p=0.01 and p<0.001 in t-test and Wilcoxon signed-rank test, respectively) (Table 4).
3. Bland-Altman analysis
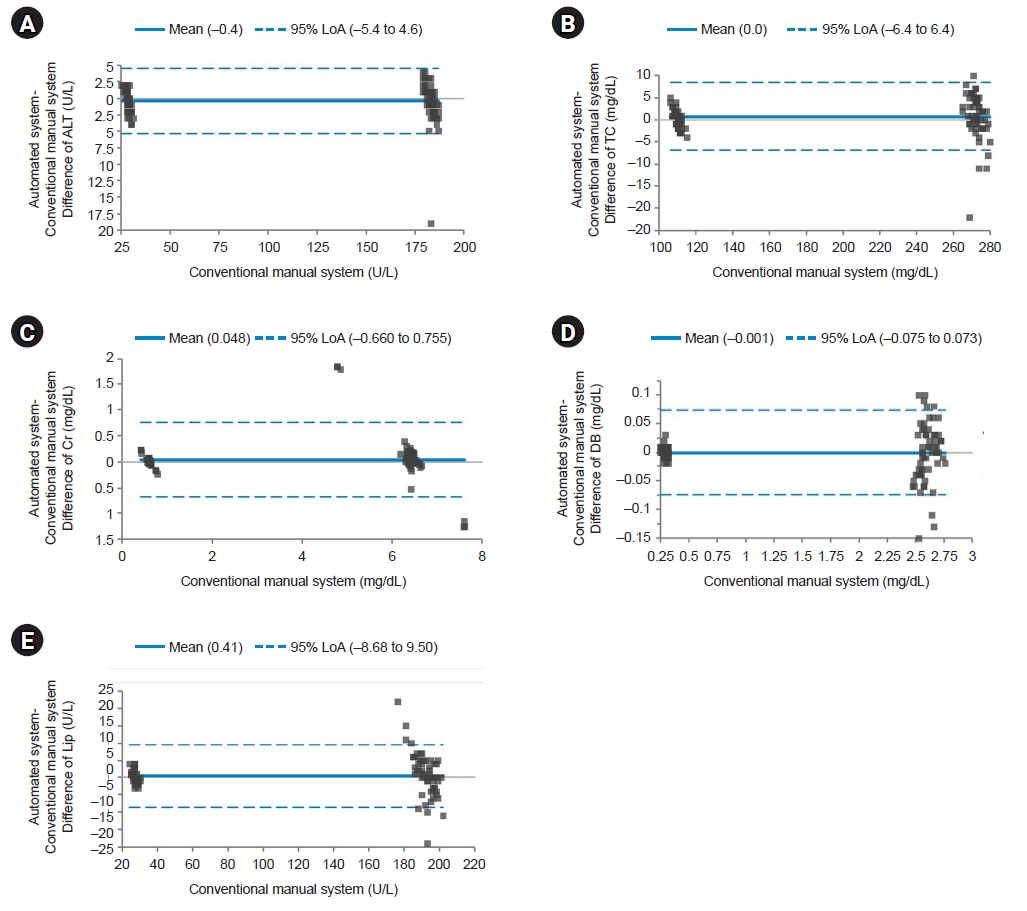
We plotted difference of each test item between the two systems for the AMR group, the MDP group, and QC materials. For AMR and MDP groups and QC materials, average values of test items with the automated system were higher than those with the manual method (bias=0.591, 0.056, and 0.163 for AMR group, MDP group, and QC materials, respectively) (Figs. 1–3). However, Lip in the AMR group, ALT in the MDP group, and ALT and DB in QC materials showed higher values with the manual method by 2.2, 0.1, 0.4, and 0.001, respectively.
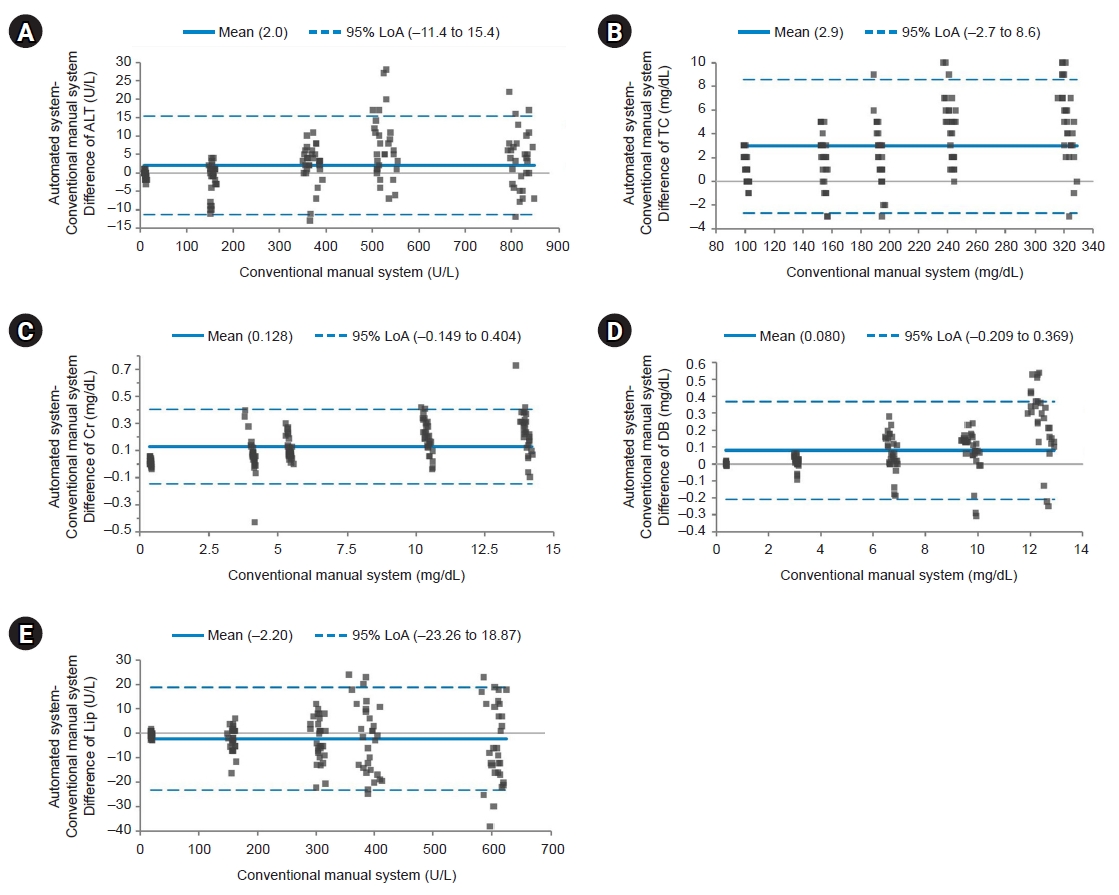
Bland-Altman plot for the analytical measurement range group. The solid line indicates the difference in the mean values of the tested items between an automated system and a conventional manual system. The dotted line indicates the 95% limits of agreement (LoA). Most points on the Bland-Altman plot are scattered within the 95% LoA. Although the majority of points in direct bilirubin (DB) are above the mean line, there seems to be no consistent bias between the values of the two systems. Most points with the lowest values are scattered below the mean line except for lipase (Lip). However, all values are within the 95% LoA. (A) Difference of alanine aminotransferase (ALT). (B) Difference of total cholesterol (TC). (C) Difference of creatinine (Cr). (D) Difference of DB. (E) Difference of Lip.
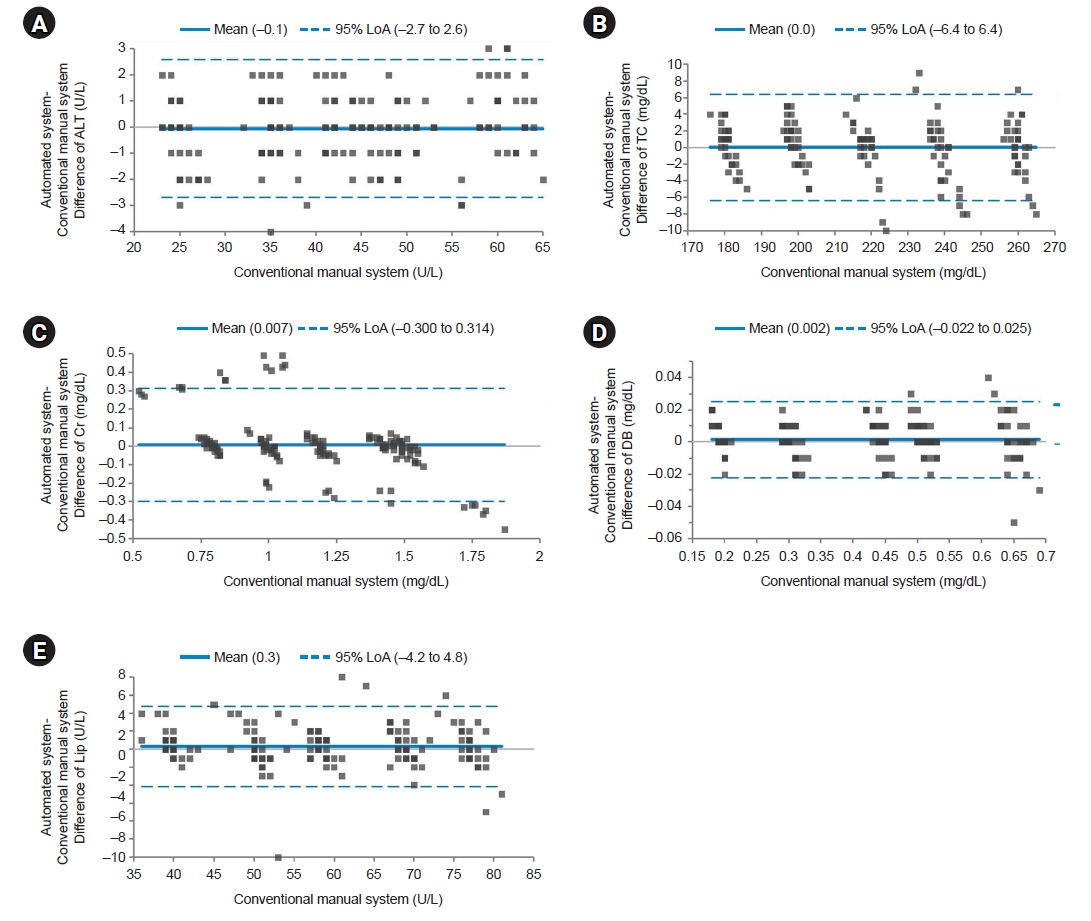
Bland-Altman plot for the medical decision point group. The solid line indicates the difference in the mean values of the tested items between an automated system and a conventional manual system. Most points on the Bland-Altman plot are scattered within the 95% limits of agreement (LoA). There seems to be no consistent bias between the values of the two systems. (A) Difference of alanine aminotransferase (ALT). (B) Difference of total cholesterol (TC). (C) Difference of creatinine (Cr). (D) Difference of direct bilirubin (DB). (E) Difference of lipase (Lip).
Bland-Altman plot for quality control materials. The solid line indicates the difference in the mean values of the tested items between an automated system and a conventional manual system. Most points on the Bland-Altman plot are scattered within the 95% limits of agreement (LoA). There seems to be no consistent bias between the values of the two systems. (A) Difference of alanine aminotransferase (ALT). (B) Difference of total cholesterol (TC). (C) Difference of creatinine (Cr). (D) Difference of direct bilirubin (DB). (E) Difference of lipase (Lip).
Discussion
Currently, many laboratories are experiencing difficulties resolving confronting problems with regard to the increasing workload caused by requests for tests and burdens due to increasing expenditure and consequent labor intensity issues related to technicians [15,16]. A laboratory automation system can improve workflow, efficiently perform qualified testing process, and reduce human errors [4]. As automated calibration and QC functions are recently provided for instruments such as chemistry analyzers, the gaining from a laboratory automation system has become more visualized. However, there are still laboratories that use instruments without automated calibration and QC functions, although they are equipped with a total laboratory automation system. In this study, the Aptio total laboratory automation system could compensate for the absence of automated calibration and QC functions in analyzers by manipulating its middleware.
The main reason for our laboratory considering automated calibration and QC was to alleviate workload and reduce turnaround time of testing. It is important to assure that the quality of calibration and QC processes in an automation system is not significantly different from that with the conventional manual method. As for repeatability, although the repeatability CV of manual method was slightly lower than that of the automation system (2.0% vs. 2.1%), the difference seemed to be acceptable between the two systems for the AMR group. However, for the MDP group, the repeatability CV showed relatively greater difference for total samples. Repeatability CVs with the manual method and automation system were 3.8% and 1.8%, respectively. This phenomenon became aggravated further based on laboratory CVs (5.1% with the automated method vs. 2.7% with the manual method). The difference of within laboratory CVs between the two systems was higher for the MDP group than for the AMR group (5.1% vs. 2.6%). Especially in the MDP group, the repeatability and within laboratory CVs for Cr showed the biggest differences between the automated method and the manual method (repeatability and within laboratory CVs were 10.2% and 13.1%, respectively, with the manual method and 1.7% and 2.1% with the automated method, respectively). Here, five Cr levels ranged from 0.792 mg/dL to 1.490 mg/dL on average. On the other hand, TG levels ranged from 199.7 mg/dL to 260.0 mg/dL, with the difference between manual and automated methods being relatively lower than that for other items (1.1% vs. 0.9%). This clearly explains that the automation system can operate repeated testing with better precision since the value of test item is low.
Although differences in repeatability and within laboratory CVs between the automated system and the conventional manual system were lower in the AMR group, significant mean differences in the value of tested items between the two systems were observed in the AMR group, but not in the MDP group except for Lip by Wilcoxon signed-rank test (p=0.029). In Table 4, mean differences of Cr levels in AMR and MDP groups were 0.13 mg/dL (p<0.001) and 0.07 mg/dL (p=0.057 in t-test), respectively. This shows that a small difference in the calibration process may result in a significant difference. We cannot affirm which value from AMR group or MDP group is more accurate or the specific trend of reported values of test items between the two systems (Figs. 1–3). However, it is certain that reported values can be different depending on calibration and QC method.
It is known that it is difficult to measure cholesterol and Cr levels accurately [17,18]. For cholesterol, various efforts have been made to accurately measure TC levels. However, obstacles still exist for accurate measurement of TC level in terms of standardization and traceability to various factors such as calibrators and QC materials [19]. Calibration and QC processes are very important to guarantee the accuracy of test results [20-22]. Especially, calibration and QC processes play more important role in these troublesome test items such as Cr and TC. As Cr has narrow reference range and the amount of quantified unit is very low, imprecision of calibration and QC can relatively give more effects on the accuracy of test results. From this perspective, automation of calibration and QC processes can be included in a routine front step among whole testing process for better precision.
Computer-directed managing technology such as an artificial intelligence is being applied to general medical industries including medical testing [23,24]. This high technology is expected to affect laboratory automation by converting its concern on automation of testing process based on a hardware-centered approach to software-based manipulation [25]. Therefore, quality management has become more important because it is essential that computer-controlled automation needs to meet requirements for quality issues to ensure quality assurance in laboratory practice as conventional QC processes do [26]. Ultimately, test results reported after automated calibration and QC processes should be as accurate as those by conventional manual method. In this study, imprecision results by the automated method seem to be acceptable compared to those by the conventional method. Additionally, all calibration and QC processes were successfully implemented with the Aptio total laboratory automation system. Regarding efficiency, the front process of laboratory testing workflow is expected to be improved by adapting the automated calibration and QC system. This supports that the idea of using automated calibration and QC processes in laboratory practice is feasible.
This research has some limitations. First, we evaluated five test items, which limited expanding drawn conclusions to other untested items. Second, we could identify significant difference of reported values between calibration and QC methods. However, standard materials were not used to evaluate the accuracy of those values in either system. Thus, which system is better in terms of accuracy could not be confirmed.
In conclusion, repeatability and within laboratory CVs between the automated system and the conventional manual system in the AMR group were similar, although means of reported values of test items were significantly different between the two systems. In the MDP group, the repeatability and within laboratory CVs were better with the automation system. Taken together, we think that the Aptio total laboratory automation system could be applied to routine practice to improve precision and efficiency.
Notes
Conflicts of interest
Hyunyong Hwang is an editorial board member of the journal but was not involved in the peer reviewer selection, evaluation, or decision process of this article. No other potential conflicts of interest relevant to this article were reported.
Funding
This research was supported by Siemens Healthineers company in 2019. We declare that we have no financial conflicts of interest.
Author contributions
Conceptualization: HH. Data curation: NK, YK, JP, JC, HH. Formal analysis: NK, YK, JP, JC, HH. Funding acquisition: HH. Investigation: NK, HH. Methodology: HH. Resources: HH. Supervision: HH. Validation: NK, HH. Visualization: NK, HH. Writing - original draft: NK, YK, JP, JC. Writing - review & editing: HH. Approval of final manuscript: all authors.