Comparative Study of Dynamic Susceptibility Contrast Perfusion MR Images between Warthin's Tumor and Malignant Parotid Tumors
Article information
Abstract
Objectives
To identify diagnostically meaningful differences between Warthin's tumor and malignant masses in the parotid gland by dynamic susceptibility contrast (DSC) MR imaging.
Methods
Eleven malignant parotid tumors and 9 Warthin's tumors were included. MR imaging was performed on all patients. Signal intensity time curves of tumors were obtained by DSC MR imaging and dynamic susceptibility contrast percentages (DSC%) were calculated.
Results
No significant difference was observed between malignant tumors and Warthin's tumors (P = 0.437), although DSC% values tended to be higher for Warthin's tumors.
Conclusions
Warthin's tumor tended to have higher DSC% values than malignant parotid tumors, but this difference was not significantly different.
INTRODUCTION
Salivary glands provide the greatest diversity of histologic types and subtypes of primary tumors,1 and of these glands, the parotid gland is more frequently affected by tumors. Parotid gland tumors account for approximately 3% of all head and neck tumors. Pleomorphic adenoma is the most common parotid neoplasm (70%), followed by Warthin's tumor and other malignancies.23 The possibility of malignancy should be ruled out in patients with any mass in the parotid gland to ensure proper management planning. This usually requires cytologic or histologic evaluation by fine needle aspiration biopsy or parotidectomy.345
Preoperative MR imaging is useful for the evaluation of tumors and for surgical planning as it allows tumor locations to be assessed. In particular, dynamic contrast-enhanced (DCE) perfusion MR imaging has been reported to be useful tool for the differentiation of salivary gland tumors.67891011 Perfusion MR imaging, which is sensitive to microvasculature, is performed with (dynamic susceptibility contrast imaging and DCE imaging) or without contrast agent (arterial spin labeling, i.e., ASL).12
Dynamic susceptibility contrast (DSC) techniques are the most widely used method to measure brain perfusion by MR imaging. DSC perfusion MR imaging has relatively shorter imaging and data acquisition times than ASL, and DCE perfusion MR imaging also allows greater anatomical coverage.12 DSC perfusion MR imaging measures signal loss during the passage of a bolus of non-diffusible contrast through a tumor,13 and can be performed using the bolus tracking technique, which monitors the first passage of contrast medium through a capillary bed. DSC perfusion MR imaging is being increasingly used to assess the extents of capillaries and of the microvasculatures of various tumors in brain, liver, and breast, and as a diagnostic and research tool. DSC perfusion MR imaging is well suited for evaluating tumor angiogenesis since the degree of signal loss depends on the volume of the intravascular space within a tumor and on the concentration of injected contrast agent in blood,14 and thus, it provides access to the physiology of microcirculation, especially of the microvasculature.15 DSC perfusion MR imaging can be helpful for evaluating brain tumors and for differentiating benign and malignant tumors,14 and has also been used to characterize and differentiate head and neck cancers.10
In a previous study, which evaluated signal intensity ratios (SIRs) on ASL images of salivary gland tumors, mean SIRs were found to be significantly higher for Warthin's tumors than those of malignant tumors representing more perfusion of Warthin's tumors than malignant tumors.9 However, other studies reported that Warthin's tumors represent more perfusion of malignant tumors than Warthin's tumors.1116 These conflicting results mean that the differential diagnosis of Warthin's tumor and malignant parotid tumors is still difficult and has a debate. Warthin's tumors contain abundant blood vessels, an extensive capillary network, and many leaky blood vessels pathologically.6 Thus, we wondered why Warthin's tumor had conflict perfusion compared with malignant parotid masses. Given the above background, we evaluated perfusion difference between Warthin's tumor and malignant parotid gland tumors on DSC perfusion MR image and reviewed the previous reports.
MATERIALS AND METHODS
This prospective study was approved by the human research committee of the institutional review board of our hospital (Approved No.: 1610-007-048). Fifty-seven consecutive patients with a parotid gland tumor treated between April 2015 and August 2016 were initially considered for the study. T1-weighted, T2-weighted, DSC perfusion, diffusion weighted (DW) MR imaging, ADC, and post-contrast MR imaging of parotid gland tumors were conducted in all patients using a 3 T scanner (Siemens Trio Tim; Siemens Medical System, Erlangen, Germany) using a standard head and neck coil.
Routine MR imaging of the parotid gland was performed in all the patients and those MR images were used for morphologic evaluation of the parotid mass. DSC perfusion MR images with a T2*-weighted gradient-echo EPI sequence were obtained following the administration of gadobutrol (Gadovist®, Bayer HealthCare) at a dose of 0.2 mmol/kg body weight. Scanning parameters were as follows: TR/TE = 1400/32 milliseconds, number of excitation = 1, flip angle = 90 degrees, section thickness = 5 mm, FOV = 23 × 23 cm2, and acquisition matrix = 128 × 128. Injections were performed using an automatic injector into right arms at a rate of 3 ml/s, and were followed by a 20 ml saline flush. Gadolinium was administrated after acquiring 8 s of data, which treated as baseline data. The data acquisition time was 110 s, and the time between the data points was 2 s. The number of slices was 19 at 55 acquisitions for per slice, and the total number of images obtained was ~1100. A post-contrast study was obtained after each dynamic study.
MR images were reviewed by a radiologist with 7 years of expertise in MR imaging but without knowledge of clinical, imaging, or final pathological results. A single region of interest (ROI) was manually drawn around maximal tumor diameters (Fig. 1). When a tumor contained solid and a cyst, the ROI was placed around the enhanced, solid portion and the cystic or necrotic portion was avoided. This ROI placement was based on the T2 and T1-weighted and contrast-enhanced MR images. TICs for ROIs on DSC were obtained automatically using a dedicated workstation (Syngo.via, Siemens Medical Solutions, Erlangen, Germany) using the T1 correction method.
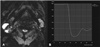
59-year-old man with Warhin's tumor.
(A) Dynamic susceptibility contrast (DSC) perfusion MR image with region-of-interest (ROI) localization. Axial susceptibility perfusion weighted MR image shows the ROI is drawn by hand around the margin of the solid component of the parotid tumor. (B) DSC% from time-signal intensity curve of the tumor was 90.36%.
Quantitative decreases in lesion signal intensities were evaluated to calculate enhancement ratios (DSC%), as defined by the following equation: DSC% = S0 – SI/S0 × 100%; where S0 represents lesion signal intensity just before signal intensity reduction and SI represents maximum contrast enhanced signal intensity.10
Pathologic data obtained by core needle biopsy or surgical biopsy were used as gold standards for diagnosis. All patients underwent surgery or biopsy within 15 days of MR imaging.
The two-tailed Student t-test was used to compare Warthin's tumor and malignant tumors (P values of < 0.05 were considered significant). The analysis was performed using SPSS version 18.0 (SPSS Inc., Chicago, IL).
RESULTS
Pathologic results were available for 11 malignant tumors and 9 Warthin's tumor. Malignant tumors included MALT lymphoma, adenocarcinoma, oncocytic adenocarcinoma, squamous cell carcinoma, salivary duct carcinoma, carcinoma ex pleomorphic adenoma, mucoepidermoid carcinoma, atypical lymphoid hyperplasia with uncertain malignancy, poorly differentiated carcinoma, primary salivary gland carcinoma, and mucoepidermoid carcinoma combined with osteosarcoma. No significant difference in maximum diameters observed between malignant tumors and Warthin tumor.
DSC% values were higher for Warthin's tumors (76.11 ± 20.29) (Fig. 1) than malignant tumors (62.82 ± 12.03) (Fig. 2). However, no significant difference was observed between Warthin's tumors and malignant tumors (P = 0.437) (Fig. 3).
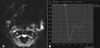
53-year-old woman with adenocarcinoma.
(A) Dynamic susceptibility contrast (DSC) perfusion MR image with region-of-interest localization.
(B) DSC% from time-signal intensity curve of the tumor was 83.38%.
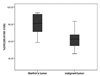
Box and whisker plots showing quantitative measurements of %DSC of Warthin's tumor and malignant tumors. %DSC was higher in Warthin's tumor (76.11 ± 20.29) than malignant tumors (62.82 ± 12.03). However, there was no significant difference between Warthin's tumor and malignant tumors (P = 0.437).
DISCUSSION
Perfusion MR imaging is non-invasive technique used to quantify brain perfusion and provides reliable values for cerebral blood flow, and has been reported to be useful tool for noninvasive assessments of tumor blood flow in patients with head and neck tumors.17 Razek et al. reported that Warthin's tumor showed lower perfusion than malignant parotid gland tumors or other head and neck malignancies.10,11 However, Kato et al.9 observed the reversed result that Warthin's tumor showed higher perfusion than malignant parotid gland tumors. In the present study, however, the mean DSC% of Warthin's tumor was 76.11 ± 20.29 and of malignant parotid gland tumors 62.82 ± 12.03. On statistical analysis, there was no significant difference between Warthin's tumor and malignant tumors (P = 0.437). Thus it seems to be impossible to differentiate two pathologies on perfusion MR images according to the present study. We suspect the discrepancy between the previous reports showing lower perfusion910 and higher perfusion11 and no perfusion difference (the present study) in Warthin's tumor than malignant tumors was probably caused by several reasons. Razek et al.10 used the circular automatic ROI on the dynamic image, represented only the part of solid mass, not a whole condition of the mass. Another report of Razek et al.11 enrolled few cases (only three cases) of Warthin's tumor and various malignant tumors in the study. Different types and composition of malignant tumors seem to be attributable to the discrepancy between Razek et al.11 and the present study. Thus to compare perfusion difference between Warthin's tumor and malignant parotid tumors, more cases of Warthin's tumor and each individual malignant tumor should be enrolled in further studies. On the contrary, Kato et al.9 used manual ROI to encompass the entire solid components and 12 Warthin's tumor and 9 malignant tumors enrolled in their study, similar ROI technique and patient numbers to our study. However, perfusion value of Warthin's tumor has 8 times of malignant tumors, and even there was no difference of perfusion between pleomorphic adenoma and malignant tumors.9 Theses results were unusual, in considering of the high vascularity of Warthin's tumor and malignant parotid tumors than pleomorphic adenoma. Pathologically, Warthin's tumors have abundant blood vessels and extensive capillary networks with many leaking blood vessels than pleomorphic adenoma.678 Xu et al.18 also demonstrated that blood volumes and flows were greater for Warthin's tumors than pleomorphic adenomas, reflecting neovascularity and angiogenic activity of Warthin's tumor.
Preoperative diagnosis of the histopathology of parotid tumors is clinically important for surgery and predicting prognosis. It is still difficult to diagnose parotid tumors preoperatively, however. Fine-needle aspiration cytology, a common diagnostic method used for parotid gland tumors, however, reveals low accuracy and sensitivity, especially for benign lesions.19 As for pleomorphic adenoma, prolonged delay can lead to malignant change. In a case of malignant mass, total parotidectomy should be performed without delay.20 In Warthin's tumors, enucleation should be performed when the diagnosis is revealed preoperatively.21
Warthin's tumor has been known as the second most common benign tumor of the parotid gland after pleomorphic adenoma. It occurs usually in middle-aged and older men in the parotid gland, involving the inferior pole of the gland.22 Warthin's tumor shows multicentric occurrence. The mass reveals well-defined margins with a variable number of cysts filled with mucous fluid. The tumor occasionally contains focal hemorrhage and necrosis.
MR imaging can clearly show the morphology of parotid gland tumor. However, it has been known that MR imaging alone is difficult to differentiate benign and malignant tumors, and that a pathologic diagnosis by MR imaging is beyond the diagnosis.23 Thus, dynamic contrast-enhanced and diffusion-weighted imaging methods has been studied for differentiate salivary gland tumors.24 The cellular components containing proteinous microcystic cysts with foamy cells, red cells, and neutrophils were recognized as hyperintensity foci on T1-weighted images and hypointense areas on T2-weighted images. Warthin tumor showed early enhancement and a high washout ratio on dynamic contrast-enhanced images. On DWI and the ADC map images, diffusion restriction of Warthin's tumors has been known as significantly lower than that of malignant tumors, especially in the case of high epithelial and lymphoid stroma with microscopic slitlike cysts filled with proteinous fluid.25 In case of large cysts showing freely movable fluid, there was no diffusion restriction. Highly viscosous contents, such as dense proteinous secretions, show lower ADC values than those of serous fluid.26
Our study has some limitations. First, the number of patients recruited was relatively small as was the number of types of parotid gland tumors included. We suggest a further large-scale study be conducted to confirm our findings. Second, we used a commercially available workstation (using Syngo.Via, Siemens Healthcare) for leakage correction. T2*-weighted acquisitions obtained by DSC perfusion MR imaging commonly have significant T1 sensitivity, and as such any contrast leakage produces artifactual elevations in the signal time course curve. Different approaches have been proposed to reduce the error introduced by contrast agent extravasation, these include, the use of preload-correction, double-echo acquisition, parametric modeling of dynamic response, and T1- and T2*-dominant extravasation correction.2728 In particular, for extracranial tumors, severe leakage of contrast agent means that perfusion imaging evaluations depend on the imaging and data processing methods used. In the present study, CBV maps were not obtained due to incomplete correction of contrast medium leakage. Further studies are required to avoid artifactually low calculation of blood volume of the tumor due to contrast leakage. Third, because ASL and dynamic contrast-enhanced MR imaging were not performed, we could not compare the diagnostic accuracies of ASL, dynamic contrast-enhanced MR imaging, and DSC perfusion MR imaging. Fourth, no intra- or inter-observer kappa statistics were obtained due to the sizes of individual categories. Fifth, accurate comparisons with the findings of Razek et al.1011 were not possible because of the different conditions used.
In conclusion, Warthin's tumor tended to have higher DSC% values than malignant parotid tumors, however, was not statistically different from malignant tumors on DSC MR imaging. In conclusion, DSC MR imaging seems to be difficult to differentiate of Warthin's tumor and malignant tumors in the parotid gland.
ACKNOWLEDGMENT
This work was supported by a 2-year Research Grant of Pusan National University.