KOSIN UNIVERSITY COLLEGE OF MEDICINE
Articles
- Page Path
- HOME > Kosin Med J > Volume 33(3); 2018 > Article
-
Original Article
Correlation between nasal mucosal thickness around the lacrimal sac fossa and surgical outcomes in endonasal dacryocystorhinostomy - Jae Ho Yoo, Chang Zoo Kim, Ki Yup Nam, Seung Uk Lee, Jae Ho Lee, Sang Joon Lee
-
Kosin Medical Journal 2018;33(3):358-368.
DOI: https://doi.org/10.7180/kmj.2018.33.3.358
Published online: December 31, 2018
1Department of Ophthalmology, College of Medicine, Kosin University, Busan, Korea.
2Department of Anesthesiology and Pain Medicine, Ulsan University Hospital, College of Medicine, Ulsan University, Ulsan, Korea.
3Institute for Medicine, College of Medicine, Kosin University, Busan, Korea.
- Corresponding Author: Sang Joon Lee, Department of Ophthalmology, College of Medicine, Kosin University, 262, Gamchun-ro, Seo-gu, Busan, 49267 Korea. Tel: +82-51-990-6228, Fax: +82-55-990-3026, hhiatus@gmail.com
• Received: November 13, 2017 • Revised: November 13, 2017 • Accepted: November 16, 2017
Copyright © 2018 Kosin University College of Medicine
Articles published in Kosin Medical Journal are open-access, distributed under the terms of the Creative Commons Attribution Non-Commercial License (http://creativecommons.org/licenses/by-nc/4.0/) which permits unrestricted non-commercial use, distribution, and reproduction in any medium, provided the original work is properly cited.
- 1,087 Views
- 1 Download
Abstract
-
Objectives
- To identify the relationship between surgical success rate and preoperative nasal mucosal thickness around the lacrimal sac fossa, as measured using computed tomography.
-
Methods
- We reviewed 33 eyes from 27 patients who underwent endoscopic dacryocystorhinostomy after diagnosis of primary nasolacrimal duct obstruction and who were followed-up with for at least six months between 2011 and 2014. We measured preoperative nasal mucosal thickness around the bony lacrimal sac fossa using computed tomography and analyzed patient measurements after classifying them into three groups: the successfully operated group, the failed operation group, and the non-operated group.
-
Results
- Surgery failed in six of the 33 eyes because of a granuloma at the osteotomy site and synechial formation of the nasal mucosa. The failed-surgery group showed a clinically significantly greater decrease in nasal mucosal thickness at the rearward lacrimal sac fossa compared with the successful-surgery group. However, nasal mucosal thickness of fellow eyes (i.e., non-operated eyes) was not significantly different between the two groups, and the location of the uncinate process did not appear to influence mucosal thickness. In the failed group, posteriorly located mucosal thickness of operated eye fossa was thinner than that of the non-operated eyes, but not significantly so.
-
Conclusions
- Our results from this quantitative anatomical study suggest that nasal mucosal thickness is a predictor of endoscopic dacryocystorhinostomy results.
- The medical records of 27 patients (33 eyes) who underwent EN-DCR at Kosin Gospel Hospital after diagnosis of primary nasolacrimal duct obstruction between January 2011 and December 2014 were reviewed in this Institutional Review Board-approved study. All patients were followed for at least six months.
- Primary nasolacrimal duct obstruction diagnoses were made using slit-lamp examination, dacryocystography, nasal endoscopy, and facial CT. Other causes of nasolacrimal duct obstruction were ruled out. Patients with secondary nasolacrimal duct obstruction, common canalicular obstruction, previous nasal cavity surgery history, or any epiphora-causing disease of the eyelid, punctal, canalicular, or ocular surface were excluded. All patients who have allergic rhinitis, sinusitis etc. were also exclude due to possibility of causing mucosal inflammation which can change the thickness of nasal mucosa.
- All surgical procedures were performed by the same surgeon using a single method, with the patient under general anesthesia. Gauze soaked with 0.1% epinephrine was packed into the nasal cavity to decongest the nasal mucosa for 10 minutes. The packed gauze soaked with epinephrine was removed, lacrimal puncta were dilated with a punctal dilator, and then a 23-gauge vitrectomy illuminator tip was inserted through the upper or lower punctum to the lacrimal sac. After identifying the location and extent of the lacrimal sac, the surgeon fixed the illumination tip.
- A local anesthetic with 1% lidocaine and 1:100,000 epinephrine was injected into the nasal mucosa using a 25-gauge needle. The nasal mucosa of the transilluminated area around the lacrimal sac fossa was cleared using a crescent blade and ethmoidal forceps. Exposed bone composed of lacrimal and maxillary bone was removed with a Kerrison punch. Exposed lacrimal sac under the lacrimal sac fossa was incised with a crescent knife and resected with ethmoidal forceps using a vitrectomy illuminator. If an uncinate process covered the operation site, unciformectomy was performed to sufficiently expose the lacrimal sac. The ostium was dilated to > 10 mm in diameter. Bicanalicular silicone intubation was performed after identifying the patency of the bypass using a Bowman probe, and a silicone-tube knot was placed in the nasal cavity.
- All patients were instructed to routinely use fluticasone furoate nasal spray twice per day for two weeks and 0.1% fluorometholone and 0.5% levofloxacin eye solution four times per day for a month. Nasal cavity cleaning was performed to remove blood clots and debris. Postoperative assessments were conducted at 1 and 2 weeks and 1, 2, 4, and 6 months, and silicone tubes were removed at postoperative three month.
- We checked for symptom improvements at every follow-up visit. If recurrent symptoms were observed, we assessed the patency of the lacrimal pathway using a lacrimal irrigation test. If the lacrimal irrigation test showed patent passage without regurgitation at postoperative six month, the surgical procedure was defined as successful.
- We used CT scans to measure nasal mucosal thickness. Contiguous 2-mm-thick axial images were obtained. The data were grouped according to location of the uncinate process around the nasolacrimal duct (anterior, middle, and posterior, Fig. 1A).
- Location of the uncinate process was defined into anterior and posterior sections according to the relative location of the nasolacrimal duct (Fig. 1B, C).
- The results were analyzed using SPSS for Windows, version 18 (SPSS Inc., Chicago, IL, USA). According to the characteristics of the data, the variables were assessed with either the Chi-square test or the Mann-Whitney U test. Differences were regarded as statistically significant if the p-value was < 0.05.
MATERIALS AND METHODS
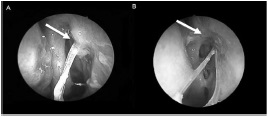
- We reviewed a total of 27 female patients (33 eyes). The mean patient age was 61.42 ± 12.42 years (Table 1). The final success rate was 75.75% (8/33), and the causes of the eight surgical failures were granulation of the ostium (5 eyes) or nasal mucosal synechiae around the ostium (3 eyes; Table 1, Fig. 2).
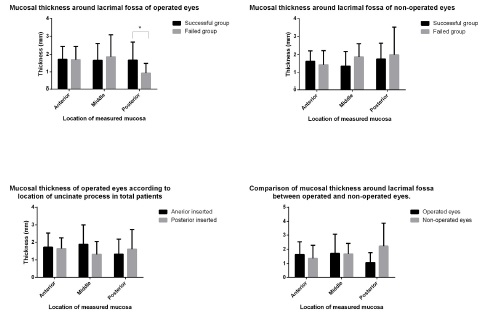
- In the successful group, mean nasal mucosal thicknesses adjacent to the lacrimal sac fossa were 1.98 ± 0.65 mm (anterior), 1.83 ± 1.08 mm (middle), and 2.67 ± 1.08 mm (posterior). In the failed group, mean nasal mucosal thicknesses around the lacrimal sac fossa were 1.46 ± 0.59 mm (anterior), 1.46 ± 0.55 mm (middle), and 1.95 ± 1.21 mm (posterior). Average nasal mucosal thicknesses were significantly thinner in the failed group than in the successful group (Table 2, Fig. 3A). Similarly, mean nasal mucosal thicknesses of the fellow eyes (non-operated) were 1.77 ± 0.64 mm (anterior), 1.47 ± 1.82 mm (middle), and 2.20 ± 0.89 mm (posterior) in the successful group and 1.44 ± 0.40 mm (anterior), 1.38 ± 1.02 mm (middle), and 1.54 ± 1.02 mm (posterior) in the failed group. There were no significant differences between the two groups (Table 2, Fig. 3B).
- There were no significant differences in the locations of uncinate processes (anterior or posterior to the lacrimal sac fossa) between the successful and failed groups. The ratio of anterior to posterior locations was 15:9 in the successful group and 6:2 in the failed group. The location of uncinate process did not appear to influence average nasal mucosal thickness. In anteriorly located cases, the average thicknesses were 1.89 ± 0.68 mm, 3.01 ± 6.45, and 2.22 ± 1.01, respectively, and in posteriorly located cases, they were 1.83 ± 0.59 mm, 1.12 ± 0.54 mm, 1.84 ± 0.70 mm (Table 3, Fig. 3C).
- Except two patients, those who got the operation on both eye, we compared the operated and fellow eyes of six patients in the failed group. The nasal mucosal thicknesses were 1.64± 0.89 mm (anterior), 1.71 ± 1.37 mm (middle), and 0.69 ± 0.34 mm (posterior) for the operated eyes and 1.36 ± 0.93 mm (anterior), 1.68 ± 0.73 mm (middle), 2.23 ± 1.64 mm (posterior) for the fellow eyes. The posterior nasal mucosa was significantly thinner in the operated eyes compared to the non-operated eyes (Table 4, Fig. 3D).
RESULTS
- Previous studies have reported that skillfulness of the operator, presence of sinusitis, history of inflammation, and operation-site infections are risk factors for EN-DCR failure.6713 However, a more recent long-term follow-up study explored the causes of failure at the mucosal-cell level, in which they found that the main cause of EN-DCR failure was complications affecting the nasal mucosa around the osteotomy site.8 They further reported that complications from EN-DCR after three months were mainly associated with the nasal mucosa, and included factors such as scar formation around the osteotomy site, adhesion of the middle turbinate and nasal septum, and granuloma formations.6141516 These complications are the result of damage to the nasal mucosa. Mucosa that is damaged during surgery is replaced by adjacent mucosal cells during recovery; the newly formed epithelial cells are transformed into myofibroblasts. This plays a major role in the fibrosis of damaged nasal mucosa, and it has been reported that cytokines, angiogenic factors, and other similar cell types are involved.171819 Further studies have reported that an increase in heat-shock protein 47, which activates the myofibroblasts in the nasal mucosa and induces fibrosis of mucous membranes, increases the degree of inflammation in the nasal mucosa, which is a risk factor for surgical failure.20 As mentioned above, the nasal mucosa plays a very important role in the development and treatment of nasolacrimal duct obstruction. However, there are no imaging studies of the nasal mucosa, despite it being the main cause of surgical failure. Previous imaging studies that explored obstruction of the nasolacrimal duct and dacryocystorhinostomy were performed only on the nasolacrimal duct, which is mainly composed of bones, the adjacent nasal septa, and sinuses.212223 This is the first imaging study to investigate the relationship between nasolacrimal duct obstruction and nasal mucosa.
- Our results showed that nasal mucosal thickness posterior to the lacrimal fossa was thinner in the failed group than in the successful group, which is thought to be the result of prolonged inflammation. All subjects had primary nasolacrimal duct obstruction caused by chronic inflammation and fibrosis of the nasal mucosa.2425 Previous reports have shown a greater inflammatory response in the nasal mucosa around the lacrimal fossa in patients with a nasolacrimal duct obstruction. Likewise, the patients in our study had chronic inflammation in the nasolacrimal duct, and the mucous membrane around the lacrimal fossa was also exposed to prolonged chronic inflammation. Chronic inflammation of the nasal cavity and paranasal sinuses leads to atrophic rhinosinusitis, which causes progressive degeneration of the normal upper respiratory tract, resulting in mucosal atrophy.26 Nasal mucosal thickness around the nasolacrimal duct in patients with nasolacrimal duct obstruction was particularly thin due to fibrosis and atrophy resulting from chronic inflammation. Though the results were not statistically significant when we compared mucosal thickness between the operated and non-operated eyes, we expect that there is a relationship between thin nasal mucosa and nasolacrimal duct obstruction.
- The mucosa around the lacrimal fossa was divided into anterior, middle, posterior parts, and the posterior part was significantly different with them of non-operated eye, which is thought to be due to inflammatory substances and gravity. Body fluids and exudates are affected by gravity; if inflammatory substances are present in the nasolacrimal duct, fluids and exudates can accumulate underneath it, resulting in higher concentrations near the inflammatory substances. When people are standing upright during the daytime, inflammatory substances will be present at high concentrations in the lower part of the nasal cavity; however, during sleep, these substances will be present at high concentrations on the rear wall of the nasal cavity. In other words, it can be assumed that the degree of inflammation of the nasal mucosa is high in the lower rear wall of the nasolacrimal duct, and the difference makes the posterior nasal mucosa thick. In our study, we did not classify patients according to height of the nasolacrimal duct; however, we could obtain more information about these anatomical parts by comparing mucosal thickness according to duct height. The degree of inflammation was confirmed by histologic findings or PCR. Future study should compare the histological findings of these nasal mucosa by location.
- The uncinate process is located in front of the middle turbinate and is a plate-shaped bone structure covered with mucosa. In some cases where the uncinate process covers the lacrimal fossa, partial uncinectomy might be necessary. Severe complications do not occur frequently in uncinectomy cases, and the surgical success rate is higher.1427282930 Uncinate processes adjacent to the mucosa around the lacrimal fossa are one of the factors that can influence nasal mucosal thickness. Herein, we found no significant differences in the location of the uncinate process between the successful and the failed groups; also, there was no difference in thickness of the nasal mucosa around the lacrimal fossa depending on the position of the uncinate process.
- Although the success rate of EN-DCR has been reported differently in many studies, the success rate of the same method as this study has been reported from 82.4% to 92.8%,3132333435 In this study, the success rate was somewhat low (75.5%), which is due to differences in patient selection and in surgical success criteria. Before selecting the patient to be taken EN-DCR, we checked the epiphora, lacrimal irrigation and dacryocystography(DCG). And only those who have complete obstruction can get the operation. However, Jung et al. reported a success rate of 92.7% and did not exclude functional closure through DCG or other tests, and Herzallah et al. reported a success rate of 87.88% and 15 of 59 patients underwent surgery under diagnosis of functional obstruction,3132 And Kim et al. reported 90.5% success rate in 127 patients including 23 partially and 3 functionally obstructed patients.35 The difference in patient selection may affect the success rate of the surgery, and second, the difference in the surgical success criteria may be considered as the cause. Because, in this study, anatomical patency and subjective symptomatic improvement were defined as success when maintained for 6 months, Beshay et al. Reported anatomic success of 89.6% and symptom improvement of 81.3%, respectively.36 Even with the same subject, the results vary according to the criteria. The difference in patient selection may affect the success rate of the surgery, and second, the difference in the surgical success criteria may be considered as the cause. Because, in this study, anatomical patency and subjective symptomatic improvement were defined as success when maintained for 6 months, Beshay et al. Reported anatomic success of 89.6% and symptom improvement of 81.3%, respectively. Even with the same subject, the results vary according to the criteria. Two factors may have contributed to the difference in success rates between this study and the existing report, but further studies will be needed for more patients. The second is the cutting length error. In our hospital, the facial CT acquires the image section 2 mm. Measuring the length based on the section cut in 2 mm increments can not accurately measure the thickness change between the sections, which can cause errors,37 MRI or orbital CT can be taken to obtain a thinner cross-section, but this study is limited due to its retrospective design. And considering the MRI or orbital CT, the former provides a higher resolution for viewing soft tissue, but at a higher cost, the latter is considered a more realistic alternative.
- There are some patients show no change on nasal mucosa, even though there is nasolacrimal duct obstruction. In this study, we found just the differences of nasal mucosal thickness between the success eye and the failed eye of EN-DCR surgery. Although the change of mucosal thickness was not seen every patient, still it has the possibility of being the prognostic factor of surgical failure. For proving, it requires further studies about the nasal mucosa, and they have to include the molecular level investigations like inflammatory cytokine, mRNA
- We are the first to attempt an anatomical study of the nasal mucosa in patients with nasolacrimal duct obstruction using computed tomography. We recommend CT scan to every patient with nasolacrimal duct obstruction for identifying the structure of intranasal area and lacrimal cyst other inflammation sign, the presence of septal deviation and measuring of nasal mucosal thickness, which might give preoperative surgical informations for EN-DCR.
DISCUSSION
Acknowledgments
Acknowledgments
- 1. Woog JJ. The incidence of symptomatic acquired lacrimal outflow obstruction among residents of Olmsted County, Minnesota, 1976–2000 (an American Ophthalmological Society thesis). Trans Am Ophthalmol Soc 2007;105:649–666.PubMedPMC
- 2. Dietrich C, Mewes T, Kühnemund M, Hashemi B, Mann WJ, Amedee RG. Long-term follow-up of patients with microscopic endonasal dacryocystorhinostomy. Am J Rhinol 2003;17:57–61.ArticlePubMed
- 3. Hartikainen J, Antila J, Varpula M, Puukka P, Seppä H, Grénman R. Prospective randomized comparison of endonasal endoscopic dacryocystorhinostomy and external dacryocystorhinostomy. Laryngoscope 1998;108:1861–1866.ArticlePubMed
- 4. Leong SC, Karkos PD, Burgess P, Halliwell M, Hampal S. A comparison of outcomes between nonlaser endoscopic endonasal and external dacryocystorhinostomy: single-center experience and a review of British trends. Am J Otolaryngol 2010;31:32–37.ArticlePubMed
- 5. Leong SC, Macewen CJ, White PS. A systematic review of outcomes after dacryocystorhinostomy in adults. Am J Rhinol Allergy 2010;24:81–90.ArticlePubMed
- 6. Allen KM, Berlin AJ, Levine HL. Intranasal endoscopic analysis of dacrocystorhinostomy failure. Ophthalmic Plast Reconstr Surg 1988;4:143–145.PubMed
- 7. Nussbaumer M, Schreiber S, Yung MW. Concomitant nasal procedures in endoscopic dacryocystorhinostomy. J Laryngol Otol 2004;118:267–269.ArticlePubMed
- 8. Goldberg RA. Endonasal dacryocystorhinostomy: is it really less successful? Arch Ophthalmol 2004;122:108–110.ArticlePubMed
- 9. Ali MJ, Mishra DK, Baig F, Naik MN. Histopathology, Immunohistochemistry, and Electron Microscopic features of a Dacryocystorhinostomy Ostium Cicatrix. Ophthalmic Plast Reconstr Surg 2016;32:333–336.ArticlePubMed
- 10. Ali MJ, Baig F, Lakshman M, Naik MN. Electron microscopic features of nasal mucosa treated with topical and circumostial injection of mitomycin C: implications in dacryocystorhinostomy. Ophthalmic Plast Reconstr Surg 2015;31:103–107.ArticlePubMed
- 11. Heindl LM, Junemann A, Holbach LM. A clinicopathologic study of nasal mucosa in 350 patients with external dacryocystorhinostomy. Orbit 2009;28:7–11.ArticlePubMed
- 12. Mauriello JA Jr, Palydowycz S, DeLuca J. Clinicopathologic study of lacrimal sac and nasal mucosa in 44 patients with complete acquired nasolacrimal duct obstruction. Ophthalmic Plast Reconstr Surg 1992;8:13–21.ArticlePubMed
- 13. Onerci M, Orhan M, Ogretmenoğlu O, Irkec M. Long-term results and reasons for failure of intranasal endoscopic dacryocystorhinostomy. Acta Otolaryngol 2000;120:319–322.ArticlePubMed
- 14. Fayet B, Racy E, Assouline M. Systematic unciformectomy for a standardized endonasal dacryocystorhinostomy. Ophthalmology 2002;109:530–536.ArticlePubMed
- 15. Häusler R, Caversaccio M. Microsurgical endonasal dacryocystorhinostomy with long-term insertion of bicanalicular silicone tubes. Arch Otolaryngol Head Neck Surg 1998;124:188–191.ArticlePubMed
- 16. Jokinen K, Kärjä J. Endonasal dacryocystorhinostomy. Arch Otolaryngol 1974;100:41–44.ArticlePubMed
- 17. Wilhelm DL. Regeneration of tracheal epithelium. J Pathol Bacteriol 1953;65:543–550.ArticlePubMed
- 18. Watelet JB, Bachert C, Gevaert P, Van Cauwenberge P. Wound healing of the nasal and paranasal mucosa: a review. Am J Rhinol 2002;16:77–84.ArticlePubMed
- 19. Wynn TA. Cellular and molecular mechanisms of fibrosis. J Pathol 2008;214:199–210.ArticlePubMedPMC
- 20. Smirnov G, Pirinen R, Tuomilehto H, Seppä J, Teräsvirta M, Uusitalo H, et al. Strong expression of HSP47 in metaplastic nasal mucosa may predict a poor outcome after primary endoscopic dacryocystorhinostomy: a prospective study. Acta Ophthalmol 2011;89:e132–e136.ArticlePubMed
- 21. Gul A, Aslan K, Karli R, Ariturk N, Can E. A Possible Cause of Nasolacrimal Duct Obstruction: Narrow Angle Between Inferior Turbinate and Upper Part of the Medial Wall of the Maxillary Sinus. Curr Eye Res 2016;41:729–733.ArticlePubMed
- 22. Yong AM, Zhao DB, Siew SC, Goh PS, Liao J, Amrith S. Assessment of bony nasolacrimal parameters among Asians. Ophthalmic Plast Reconstr Surg 2014;30:322–327.ArticlePubMed
- 23. McCormick A, Sloan B. The diameter of the nasolacrimal canal measured by computed tomography: gender and racial differences. Clin Exp Ophthalmol 2009;37:357–361.ArticlePubMed
- 24. Bartley GB. Acquired lacrimal drainage obstruction: an etiologic classification system, case reports, and a review of the literature. Part 3. Ophthalmic Plast Reconstr Surg 1993;9:11–26.PubMed
- 25. Onerci M. Dacryocystorhinostomy. Diagnosis and treatment of nasolacrimal canal obstructions. Rhinology 2002;40:49–65.PubMed
- 26. Ly TH, deShazo RD, Olivier J, Stringer SP, Daley W, Stodard CM. Diagnostic criteria for atrophic rhinosinusitis. Am J Med 2009;122:747–753.ArticlePubMed
- 27. Fayet B, Racy E, Assouline M. Complications of standardized endonasal dacryocystorhinostomy with unciformectomy. Ophthalmology 2004;111:837–845.ArticlePubMed
- 28. Fayet B, Racy E, Assouline M, Zerbib M. Surgical anatomy of the lacrimal fossa a prospective computed tomodensitometry scan analysis. Ophthalmology 2005;112:1119–1128.ArticlePubMed
- 29. Woo KI, Maeng HS, Kim YD. Characteristics of intranasal structures for endonasal dacryocystorhinostomy in asians. Am J Ophthalmol 2011;152:491–498.e1.ArticlePubMed
- 30. Yang JW, Oh HN. Success rate and complications of endonasal dacryocystorhinostomy with unciformectomy. Graefes Arch Clin Exp Ophthalmol 2012;250:1509–1513.ArticlePubMedPMC
- 31. Jung SK, et al. Surgical outcomes of endoscopic dacryocystorhinostomy: analysis of 1083 consecutive cases. Can J Ophthalmol 2015;50:466–470.ArticlePubMed
- 32. Karim R, et al. A comparison of external and endoscopic endonasal dacryocystorhinostomy for acquired nasolacrimal duct obstruction. Clin Ophthalmol 2011;5:979–989.ArticlePubMedPMC
- 33. Herzallah I, et al. Endoscopic Dacryocystorhinostomy (DCR): a comparative study between powered and non-powered technique. J Otolaryngol Head Neck Surg 2015;44:56.ArticlePubMedPMC
- 34. Sarode D, et al. The benefit of silicone stents in primary endonasal dacryocystorhinostomy: a systematic review and meta-analysis. Clin Otolaryngol 2017;42:307–314.ArticlePubMed
- 35. Kim SY, et al. No thermal tool using methods in endoscopic dacryocystorhinostomy: no cautery, no drill, no illuminator, no more tears. Eur Arch Otorhinolaryngol 2013;270:2677–2682.ArticlePubMed
- 36. Beshay N, Ghabrial R. Anatomical and subjective success rates of endonasal dacryocystorhinostomy over a seven-year period. Eye (Lond) 2016;30:1458–1461.ArticlePubMedPMC
- 37. Kostis WJ, et al. Small pulmonary nodules: reproducibility of three-dimensional volumetric measurement and estimation of time to follow-up CT. Radiology 2004;231:446–452.ArticlePubMed
References
Fig. 1
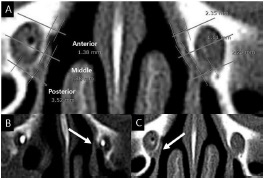
The CT images of nasal mucosa and bony structure. A) Measurement of nasal mucosal thickness around the bony nasolacrimal duct, classified into anterior, middle, posterior areas. Lines indicate the anterior, middle, and posterior borders of the bony nasolacrimal duct. Uncinate processes located B) anterior and C) posterior to the bony nasolacrimal duct. Arrows indicate an uncinate process.
Fig. 2

The images of surgical failure EN-DCR due to ostium closure. A) Arrow indicates granuloma in the ostium. B) Arrow indicates synechiae with nasal mucosa around the ostium.
Fig. 3

The graph of mean mucosal thicknesses around lacrimal fossa of all patients. A) Comparison of mucosal thickness around the lacrimal fossa of operated eyes between the successful and failed groups. Only the posterior lacrimal fossa mucosa was significantly different. B) Comparison of mucosal thicknesses around the lacrimal fossa of non-operated eyes between the successful and failed groups. There were no significant differences at any location between the successful and failed groups. C) Comparisons of mucosal thickness of the operated eyes according to location of uncinate processes in the total patient group. D) Comparisons of mucosal thickness of the operated eyes according to location of uncinate processes in the total patient group.


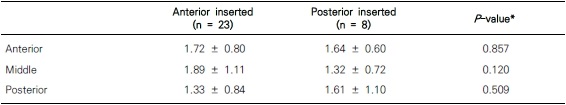

Figure & Data
References
Citations
Citations to this article as recorded by 
 PubReader
 Cite
Cite